Would you risk losing a second on your page speed?
Well, if you are, you should be sure it’s worth it: the probability that a user bounces off of your page increases 32% as the page load time goes from one to three seconds.
We understand how important it is for our partners to gain and maintain engagement from users. We’re best known for developing products that boost engagement and build audience, but we know that the reader’s experience starts before the page even loads.
To that end, we’ve developed the best and lightest performing community platform on the web.
We want to make sure we’re building the best-in-class experience for your readers, so we routinely test our products against the alternatives.
We Ran The Numbers
The results are in: [Spoiler Alert] overall, we’re the fastest platform. We’re excited to share the details.
Following our report below, we’ll provide some more context and analysis of what these numbers really mean, and how we’re planning on getting even better.

Largest Contentful Paint (LCP) measures your site’s overall loading performance. A great LCP is below 2.5 seconds.
OpenWeb scored 2.4 seconds, while the alternative scored 5.06 seconds. OpenWeb is 53% faster than the alternative in displaying the largest contentful paint.
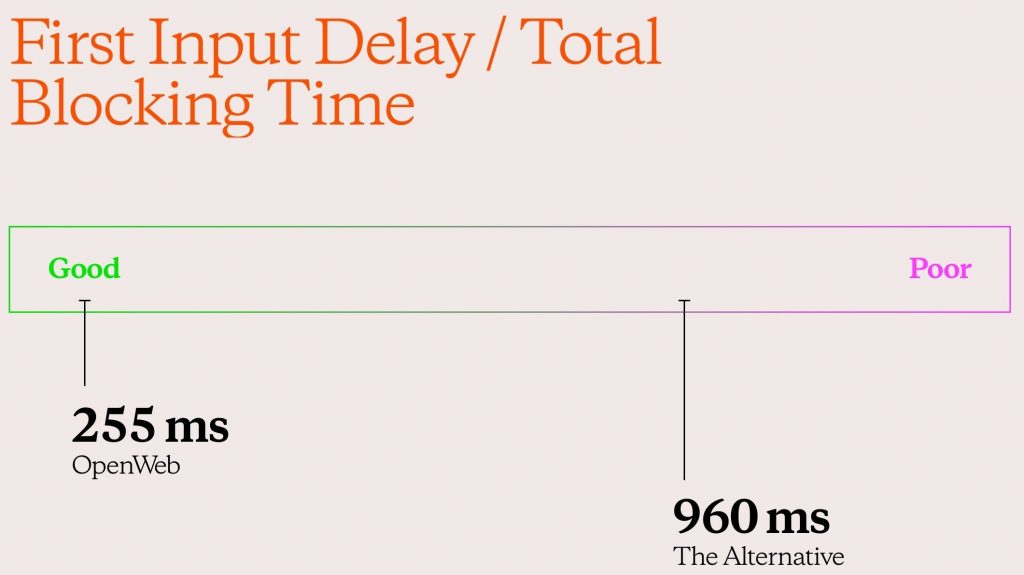
First Input Delay (FID) measures user interactivity and requires a real user to measure. So, to test this metric in a controlled environment, we use a different measurement that captures interactivity issues called Total Blocking Time (TBT).
OpenWeb scored 255 milliseconds, while the alternative scored 960 milliseconds. OpenWeb is 74% lighter than the alternative.
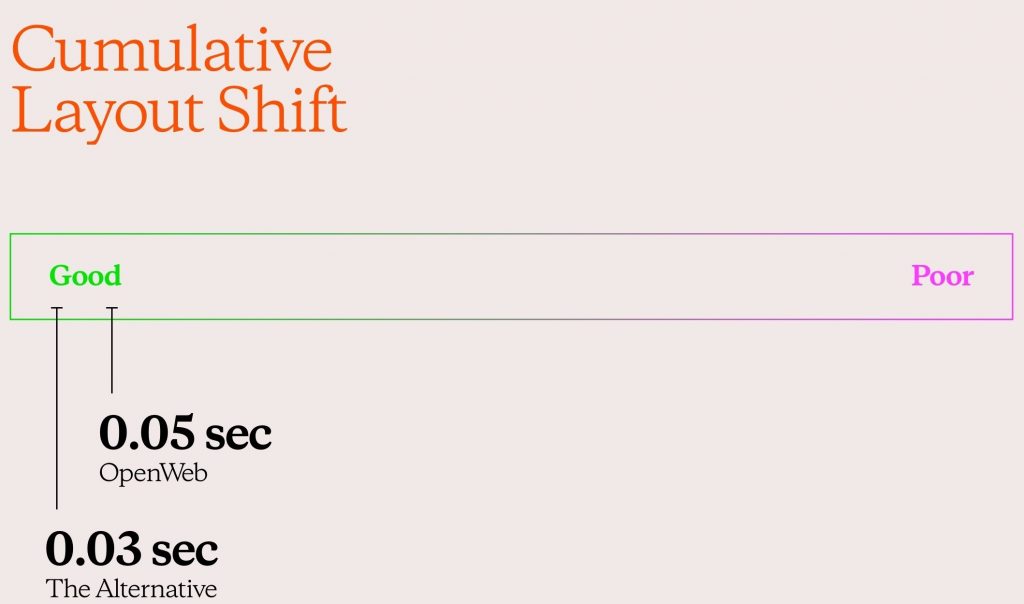
Cumulative Layout Shift (CLS) assesses visual stability. A good score is anything below 0.1 seconds.
OpenWeb scored 0.05 seconds, while the alternative scored 0.03 seconds. While both products scored great, the alternative’s score was slightly better than OpenWeb.

PageSpeed Insights also provides a score that summarizes the page’s overall performance. Running Google Lighthouse determines this score and allows you to collect and analyze controlled web page data. A score below 50 is considered poor.
OpenWeb scored 75 points, while the alternative scored 51 points. OpenWeb is 48% faster than the alternative, using the Google PageSpeed Insights Performance Benchmark.
How We Calculated The Numbers
We calculated these numbers using Google’s PageSpeed Insights. The tool gives developers a breakdown of the numbers we outlined above.
Both OpenWeb and the alternative offer an integrated solution instead of a standalone website. So we benchmarked their performance in isolation using the Google PageSpeed Insights Lab Data. We measured both products in the same isolated environment, comparing all metrics on both Desktop and Mobile.
Our team ran the test dozens of times on each product and used the average of the results as the final score.
Better Core Vitals = Better Rankings on Google
Over the years, Google has made it no secret that a faster page load time positively impacts your page’s search rankings. Google has made a commitment to a positive user experience and with that comes recommended pages that are fast, easy-to-use, and relevant.
Starting in May 2021, Google combined Core Web Vitals with its previous indicators for site performance. Websites with poor Core Web Vitals may find their search engine ranking negatively impacted.
Source: https://webmasters.googleblog.com/2020/05/evaluating-page-experience.html
We’re already the fastest–but still improving. Here’s how.
Web page performance is a major priority for us. We follow advanced techniques and methodologies to improve our products. Our excellent scores shown above are a direct result of our focused work on our product’s performance. By using parallel loading of our products’ various bundles, we can load bundles at once. Furthermore, we are optimizing our load time with a lazy loading approach. This approach allows us to load certain functionality by demand.
We constantly monitor the performance changes of both our products and our partners. We use a combination of the Lighthouse API and the Chrome UX Report to track changes and ensure we’re on the right path.
We set performance goals for each product we provide and consistently meet these goals every quarter.
In our next performance post, we’ll share some of the performance optimizations we’ve been working on this past year, including Brotli compression, advanced CDN usage, advanced browser caching, and more. Stay tuned.